모니터링 서비스가 없으면 정말 불편합니다. 간단한 예로 ~
- 하루는 출근했는데 "** 서비스가 실행이 안되는데?" 확인해보니 메모리 초과로 셧다운되있었습니다.
- 개발 서버에서 테스트 중에 public망에 있던 서비스와 통신 중에 계속 에러가 발생 확인해보니 셧다운되있었습니다.
- ** 서비스 죽었어? 잠시만요... 터미널 열고 타자
다다다다다ps -ef... docker ps .. 매번 이럴순 없습니다.
소스는 github에 올려놓았습니다.
- 1편 - actuator 적용한 application을 띄우기
- 2편 - monitoring application, prometheus docker로 띄우기
- 3편 - Grafana docker로 띄우기
- 4편 - AlertManager 적용

actuator는 Spring Initializer에서 간단하게 추가하고 몇가지 설정만 하면 서비스에 대한 다양한 정보를 얻을 수 있습니다. info, health, metrics 등등. 전 이 정보를 prometheus에서 받아 Grafana로 보이는 작업을 하려고 합니다.
사전 지식으로 필요한 것들
- prometheus
- grafana
- docker
빠른 시일내에 정리하는 글을 올리겠습니다!
application docker 실행
prometheus, grafana를 docker로 띄울 예정이니 application도 docker로 띄워보겠습니다.
build.gradle파일에 bootJar를 추가합니다.
bootJar {
	enabled = true
	mainClassName = 'com.example.monitoring.MonitoringApplication'
}
그리고 어플리케이션을 실행하면 jar 파일이 생성됩니다.
build/libs/monitoring-0.0.1-SNAPSHOT.jar이 파일을 이용해서 Docker를 띄워보겠습니다.
Dockerfile
먼저 Dockerfile을 생성합니다. ( Docker를 다루는 글은 따로 작성할 예정입니다. )
FROM openjdk:8-jdk-alpine
VOLUME /tmp
ADD monitoring-0.0.1-SNAPSHOT.jar app.jar
ENV JAVA_OPTS=""
ENTRYPOINT ["java","-Djava.security.egd=file:/dev/./urandom","-jar","/app.jar"]
Dockerfile 위치 기준으로 ADD 의 jar파일 (경로포함)을 설정합니다.
Dockerfile을 build 합니다.
docker build -t monitoring-application-docker .
정상적으로 image가 생성되었는지 확인합니다.
docker images
docker를 실행합니다.
docker run -d --name=monitoring-application -p 8080:8080 monitoring-application-docker
정상적으로 기동되었는지 확인합니다.
docker ps
로그도 확인할 수 있습니다 :)
// docker logs -f <dockerID>
docker logs -f edc30b51c06a
application을 docker로 띄워봤습니다!
prometheus 설치
docker pull prom/prometheusUsing default tag: latest
latest: Pulling from prom/prometheus
76df9210b28c: Pull complete
559be8e06c14: Pull complete
f2a3d2457edd: Pull complete
c10a6fd58778: Pull complete
2ad73ff104d9: Pull complete
aec3e0b4446f: Pull complete
4cb49d0057e3: Pull complete
04db6a5b5334: Pull complete
ca0f04bfda22: Pull complete
ffd457fc1981: Pull complete
9fcdfe67a33b: Pull complete
d4f360942982: Pull complete
Digest: sha256:f7ffebdd428ba005e2c65ec1c7debdffdd39c43eb6bd0ddfa64ea7aba2a3fd14
Status: Downloaded newer image for prom/prometheus:latest
docker.io/prom/prometheus:latest설치 확인
docker imagesREPOSITORY TAG IMAGE ID CREATED SIZE
prom/prometheus latest 6fa696e177e3 8 days ago 168MBprometheus 설정
설정하기에 앞서 docker간 통신에 필요한 ip를 얻어오겠습니다.
Monitoring 어플리케이션을 Docker로 띄웠기때문에 localhost로 지정하면 찾을 수가 없습니다.
docker끼리 통신을 위해서 docker ip를 조회합니다.
docker network inspect bridge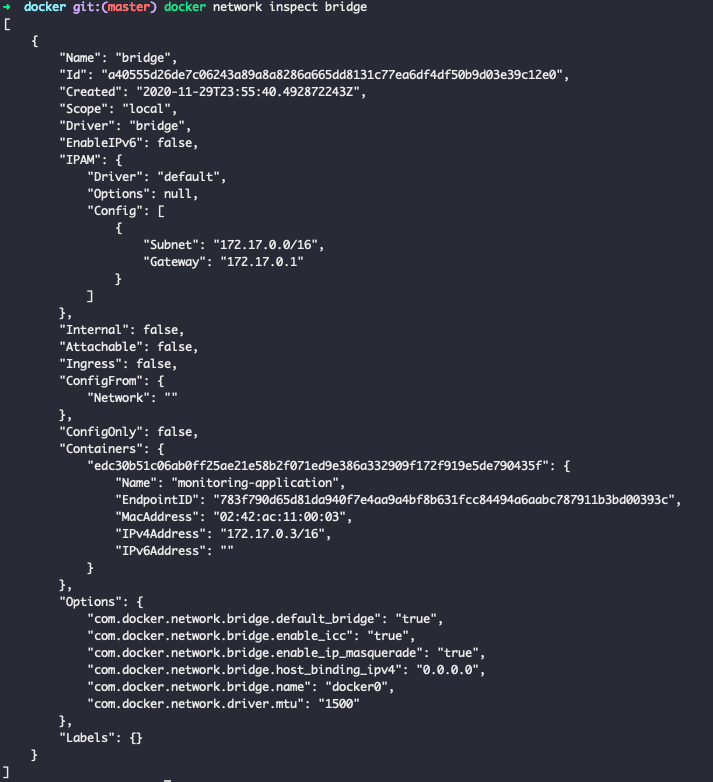
docker의 IPv4Address 주소를 얻어올 수 있습니다.
그럼 얻어온 IP로 prometheus.yml을 작성합니다.
# my global config
global:
  scrape_interval:     5s # Set the scrape interval to every 15 seconds. Default is every 1 minute.
  evaluation_interval: 15s # Evaluate rules every 15 seconds. The default is every 1 minute.
  # scrape_timeout is set to the global default (10s).

# Load rules once and periodically evaluate them according to the global 'evaluation_interval'.
rule_files:
  # - "first_rules.yml"
  # - "second_rules.yml"

# A scrape configuration containing exactly one endpoint to scrape:
# Here it's Prometheus itself.
scrape_configs:
  # The job name is added as a label `job=<job_name>` to any timeseries scraped from this config.
  - job_name: 'prometheus'

    # metrics_path defaults to '/metrics'
    # scheme defaults to 'http'.

    static_configs:
    - targets: ['localhost:9090']

  - job_name: 'spring-actuator'
    metrics_path: '/actuator/prometheus'
    scrape_interval: 5s
    static_configs:
- targets: ['172.17.0.3:8080'] // IPv4Address 값- job_name : prometheus에서 모니터링 할 Job 명을 설정
- matrics_path : endpoint를 지정합니다.
- scrape_interval : 수집 주기를 설정합니다.
- static_configs: target 호스트를 지정합니다.
Prometheus docker 실행
sudo docker run \
-d --name=prometheus \
-p 9090:9090 \
-v /Users/limyongtae/Desktop/github/promethous/configuration/prometheus.yml:/etc/prometheus/prometheus.yml \
prom/prometheus \
--config.file=/etc/prometheus/prometheus.yml
docker에 대해서는 빠른 시일내에 작성할 예정입니다. 간단하게 요약하자면 기존에 방식은 서비스를 OS에 띄웁니다. OS는 덩치가 매우 큽니다. 하지만 docker를 사용하여 서비스를 띄우는 경량화된 Container를 사용하여 CPU, Memory를 효율적으로 분배하여 최소한으로 서비스를 띄울 수 있는 환경을 제공합니다.
위 명령어를 간단하게 정리하겠습니다.
- docker run : docker를 실행시키겠다.
- -d : container를 실행하는데 background로 실행하고 container ID를 print합니다.
docker run --help

// .....
-d, --detach                         Run container in background and print container ID
// .....- --name=prometheus : container 명을 설정합니다.
- -p 9090:9090 : container의 외부 포트를 설정합니다. 외부포트와 내부포트를 설정합니다.
- -v ${path} : volume을 지정합니다. container를 띄우는 OS의 경로 혹은 파일을 docker 내 지정 경로에 볼륨합니다. 다시 쉽게 정리하자면 OS의 경로 혹은 파일을 docker의 지정된 경로에 복붙합니다.
- --config.file=${file} : docker를 띄울 때 config file을 지정합니다.
docker 설치 확인
docker ps -al // docker container list보면 명령어CONTAINER ID IMAGE COMMAND CREATED STATUS PORTS NAMES
c90521d6ed40 prom/prometheus "/bin/prometheus --c…" 2 days ago Up 2 days 0.0.0.0:9090->9090/tcp prometheus위에서 설정한 값들과 비교해보겠습니다.
- --name : NAMES 필드에 보여집니다.
- -p : PORTS 필드에 보여집니다.
- -v : 확인하려면 docker 내부에 진입하여 파일을 확인합니다.
docker exec -it prometheus sh // docker 진입 명령어
docker 내부에서 -v 설정한 경로로 이동합니다.
cd /etc/promehteus                      // -v 설정한 경로 이동
ls -al                                  // 파일 목록 확인
drwxr-xr-x 1 nobody nogroup 4096 Nov 16 14:56 .
drwxr-xr-x 1 root root 4096 Nov 25 00:44 ..
lrwxrwxrwx 1 nobody nogroup 39 Nov 16 14:56 console_libraries -> /usr/share/prometheus/console_libraries
lrwxrwxrwx 1 nobody nogroup 31 Nov 16 14:56 consoles -> /usr/share/prometheus/consoles/
-rw-r--r-- 1 nobody nogroup 1114 Nov 25 00:29 prometheus.yml경로에 prometheus.yml 파일을 확인할 수 있습니다.
cat prometheus.yml# my global config
global:
scrape_interval: 5s # Set the scrape interval to every 15 seconds. Default is every 1 minute.
evaluation_interval: 15s # Evaluate rules every 15 seconds. The default is every 1 minute.
# scrape_timeout is set to the global default (10s).
# Load rules once and periodically evaluate them according to the global 'evaluation_interval'.
#rule_files:
# - "first_rules.yml"
# - "second_rules.yml"
# A scrape configuration containing exactly one endpoint to scrape:
# Here it's Prometheus itself.
scrape_configs:
# prometheus endpoint를 설정합니다.
- job_name: 'prometheus'
static_configs:
- targets: ['localhost:9090']
# actuator metrics endpoint를 설정합니다.
- job_name: 'spring-actuator'
metrics_path: '/actuator/prometheus'
scrape_interval: 5s
static_configs:
- targets: ['localhost:8081']위에서 설정한 정보가 작성되있는 것을 확인할 수 있습니다.
Prometheus 실행
-p 9090:9090으로 띄웠기 때문에 크롬 주소창에 localhost:9090 입력합니다.


Promethues가 제공해주는 UI입니다. Prometheus에서 수집 정보를 알 수 있습니다.
다음 글에서 Grafana를 띄우고 Prometheus의 AlertManager도 적용해보겠습니다.
다음글 작성중..