모니터링 서비스가 없으면 정말 불편합니다. 간단한 예로 ~
- 하루는 출근했는데 "** 서비스가 실행이 안되는데?" 확인해보니 메모리 초과로 셧다운되있었습니다.
- 개발 서버에서 테스트 중에 public망에 있던 서비스와 통신 중에 계속 에러가 발생 확인해보니 셧다운되있었습니다.
- ** 서비스 죽었어? 잠시만요... 터미널 열고 타자
다다다다다ps -ef... docker ps .. 매번 이럴순 없습니다.
소스는 github에 올려놓았습니다.
- 1편 - actuator 적용한 application을 띄우기
- 2편 - monitoring application, prometheus docker로 띄우기
- 3편 - Grafana docker로 띄우기
- 4편 - AlertManager 적용

actuator는 Spring Initializer에서 간단하게 추가하고 몇가지 설정만 하면 서비스에 대한 다양한 정보를 얻을 수 있습니다. info, health, metrics 등등. 전 이 정보를 prometheus에서 받아 Grafana로 보이는 작업을 하려고 합니다.
사전 지식으로 필요한 것들
- prometheus
- grafana
- docker
빠른 시일내에 정리하는 글을 올리겠습니다!
spring initializer 로 actuator 생성합니다.
build.gradle
plugins {
	id 'org.springframework.boot' version '2.4.0'
	id 'io.spring.dependency-management' version '1.0.10.RELEASE'
	id 'java'
}

group = 'com.example'
version = '0.0.1-SNAPSHOT'
sourceCompatibility = '1.8'

configurations {
	compileOnly {
		extendsFrom annotationProcessor
	}
}

repositories {
	mavenCentral()
}

dependencies {
	implementation 'org.springframework.boot:spring-boot-starter-actuator'  // actuator
	implementation 'org.springframework.boot:spring-boot-starter-web'
	compileOnly 'org.projectlombok:lombok'
	developmentOnly 'org.springframework.boot:spring-boot-devtools'
	runtimeOnly 'io.micrometer:micrometer-registry-prometheus'		// 1)
	annotationProcessor 'org.projectlombok:lombok'
	testImplementation 'org.springframework.boot:spring-boot-starter-test'
}

test {
	useJUnitPlatform()
}
1) actuator metrics 정보를 prometheus에서 읽을 수 있도록 변환해주는 디펜던시입니다.
application.yaml
spring:
  profiles:
    active: local


--- # local
spring:
  config:
    activate:
      on-profile: local

management:
#  server:					# 1)
#    port: 8081
#    address: 127.0.0.1
  endpoint:					# 2)
    shutdown:
      enabled: false
    info:
      enabled: true
    metrics:
      enabled: true
    health:
      enabled: true
    prometheus:
      enabled: true

  endpoints:				# 3)
    web:
      exposure:
        include: metrics, info, health, prometheus
1) actuator에서 제공해주는 정보를 제공해줄 서버를 따로 생성하겠다는 의미입니다. 이 프로젝트에서는 따로 설정하지 않겠습니다.
2) 노출시킬 endpoint를 설정합니다.
- shutdown은 default가 false입니다. 실제 어플리케이션을 내릴 수 있는 위험한 endpoint이므로 되도록이면 false를 선언합니다.
3) 모든 endpoint들에 대한 설정입니다.
- web.exposure.include : 노출시킬 endpoint를 설정해줍니다.
실행
/Library/Java/JavaVirtualMachines/jdk1.8.0_261.jdk/Contents/Home/bin/java -XX:TieredStopAtLevel=1 -noverify -Dspring.output.ansi.enabled=always -Dcom.sun.management.jmxremote -Dspring.jmx.enabled=true -Dspring.liveBeansView.mbeanDomain -Dspring.application.admin.enabled=true -javaagent:/Users/limyongtae/Library/Application Support/JetBrains/Toolbox/apps/IDEA-U/ch-0/202.7660.26/IntelliJ IDEA.app/Contents/lib/idea_rt.jar=65084:/Users/limyongtae/Library/Application Support/JetBrains/Toolbox/apps/IDEA-U/ch-0/202.7660.26/IntelliJ IDEA.app/Contents/bin -Dfile.encoding=UTF-8 -classpath /Library/Java/JavaVirtualMachines/jdk1.8.0_261.jdk/Contents/Home/jre/lib/charsets.jar:/Library/Java/JavaVirtualMachines/jdk1.8.0_261.jdk/Contents/Home/jre/lib/deploy.jar:/Library/Java/JavaVirtualMachines/jdk1.8.0_261.jdk/Contents/Home/jre/lib/ext/cldrdata.jar:/Library/Java/JavaVirtualMachines/jdk1.8.0_261.jdk/Contents/Home/jre/lib/ext/dnsns.jar:/Library/Java/JavaVirtualMachines/jdk1.8.0_261.jdk/Contents/Home/jre/lib/ext/jaccess.jar:/Library/Java/JavaVirtualMachines/jdk1.8.0_261.jdk/Contents/Home/jre/lib/ext/jfxrt.jar:/Library/Java/JavaVirtualMachines/jdk1.8.0_261.jdk/Contents/Home/jre/lib/ext/localedata.jar:/Library/Java/JavaVirtualMachines/jdk1.8.0_261.jdk/Contents/Home/jre/lib/ext/nashorn.jar:/Library/Java/JavaVirtualMachines/jdk1.8.0_261.jdk/Contents/Home/jre/lib/ext/sunec.jar:/Library/Java/JavaVirtualMachines/jdk1.8.0_261.jdk/Contents/Home/jre/lib/ext/sunjce_provider.jar:/Library/Java/JavaVirtualMachines/jdk1.8.0_261.jdk/Contents/Home/jre/lib/ext/sunpkcs11.jar:/Library/Java/JavaVirtualMachines/jdk1.8.0_261.jdk/Contents/Home/jre/lib/ext/zipfs.jar:/Library/Java/JavaVirtualMachines/jdk1.8.0_261.jdk/Contents/Home/jre/lib/javaws.jar:/Library/Java/JavaVirtualMachines/jdk1.8.0_261.jdk/Contents/Home/jre/lib/jce.jar:/Library/Java/JavaVirtualMachines/jdk1.8.0_261.jdk/Contents/Home/jre/lib/jfr.jar:/Library/Java/JavaVirtualMachines/jdk1.8.0_261.jdk/Contents/Home/jre/lib/jfxswt.jar:/Library/Java/JavaVirtualMachines/jdk1.8.0_261.jdk/Contents/Home/jre/lib/jsse.jar:/Library/Java/JavaVirtualMachines/jdk1.8.0_261.jdk/Contents/Home/jre/lib/management-agent.jar:/Library/Java/JavaVirtualMachines/jdk1.8.0_261.jdk/Contents/Home/jre/lib/plugin.jar:/Library/Java/JavaVirtualMachines/jdk1.8.0_261.jdk/Contents/Home/jre/lib/resources.jar:/Library/Java/JavaVirtualMachines/jdk1.8.0_261.jdk/Contents/Home/jre/lib/rt.jar:/Library/Java/JavaVirtualMachines/jdk1.8.0_261.jdk/Contents/Home/lib/ant-javafx.jar:/Library/Java/JavaVirtualMachines/jdk1.8.0_261.jdk/Contents/Home/lib/dt.jar:/Library/Java/JavaVirtualMachines/jdk1.8.0_261.jdk/Contents/Home/lib/javafx-mx.jar:/Library/Java/JavaVirtualMachines/jdk1.8.0_261.jdk/Contents/Home/lib/jconsole.jar:/Library/Java/JavaVirtualMachines/jdk1.8.0_261.jdk/Contents/Home/lib/packager.jar:/Library/Java/JavaVirtualMachines/jdk1.8.0_261.jdk/Contents/Home/lib/sa-jdi.jar:/Library/Java/JavaVirtualMachines/jdk1.8.0_261.jdk/Contents/Home/lib/tools.jar:/Users/limyongtae/Desktop/github/monitoring/build/classes/java/main:/Users/limyongtae/Desktop/github/monitoring/build/resources/main:/Users/limyongtae/.gradle/caches/modules-2/files-2.1/org.projectlombok/lombok/1.18.16/6dc192c7f93ec1853f70d59d8a6dcf94eb42866/lombok-1.18.16.jar:/Users/limyongtae/.gradle/caches/modules-2/files-2.1/org.springframework.boot/spring-boot-starter-actuator/2.4.0/9b84db09f3ef2b97baf05fe4c6d9446849ca5962/spring-boot-starter-actuator-2.4.0.jar:/Users/limyongtae/.gradle/caches/modules-2/files-2.1/org.springframework.boot/spring-boot-starter-web/2.4.0/4bdd422c370d1d66ffc12ecafdecc70cad406367/spring-boot-starter-web-2.4.0.jar:/Users/limyongtae/.gradle/caches/modules-2/files-2.1/org.springframework.boot/spring-boot-starter/2.4.0/26162567b7644e6d245b9d8dcf6fd4efb2bf74f4/spring-boot-starter-2.4.0.jar:/Users/limyongtae/.gradle/caches/modules-2/files-2.1/org.springframework.boot/spring-boot-actuator-autoconfigure/2.4.0/f43536c7816f2a12c812708741baa7057e949000/spring-boot-actuator-autoconfigure-2.4.0.jar:/Users/limyongtae/.gradle/caches/modules-2/files-2.1/io.micrometer/micrometer-core/1.6.1/56ef19504900ec907bafe2edb0512cd5c0ee19ec/micrometer-core-1.6.1.jar:/Users/limyongtae/.gradle/caches/modules-2/files-2.1/org.springframework.boot/spring-boot-starter-json/2.4.0/e688a97ab229ae5a4a0c3ccb3f4419c9457a25b6/spring-boot-starter-json-2.4.0.jar:/Users/limyongtae/.gradle/caches/modules-2/files-2.1/org.springframework.boot/spring-boot-starter-tomcat/2.4.0/479b11585d1015a4c27f605d94ace7de57dd06d1/spring-boot-starter-tomcat-2.4.0.jar:/Users/limyongtae/.gradle/caches/modules-2/files-2.1/org.springframework/spring-webmvc/5.3.1/17493978f251b7e51393cdf19f4f51af9c1f04f2/spring-webmvc-5.3.1.jar:/Users/limyongtae/.gradle/caches/modules-2/files-2.1/org.springframework/spring-web/5.3.1/4e1e1d1c6b5a00597162db84132414c409bcf615/spring-web-5.3.1.jar:/Users/limyongtae/.gradle/caches/modules-2/files-2.1/org.springframework.boot/spring-boot-autoconfigure/2.4.0/e1f7cd3b65e4706fbe3160c76f5815d4dbc79915/spring-boot-autoconfigure-2.4.0.jar:/Users/limyongtae/.gradle/caches/modules-2/files-2.1/org.springframework.boot/spring-boot/2.4.0/d8c0caa04526c8cc1dfcbb9c5badae3c99c49884/spring-boot-2.4.0.jar:/Users/limyongtae/.gradle/caches/modules-2/files-2.1/org.springframework.boot/spring-boot-starter-logging/2.4.0/4f1ba27a364170a26bbd448b14ba3907d21f2154/spring-boot-starter-logging-2.4.0.jar:/Users/limyongtae/.gradle/caches/modules-2/files-2.1/jakarta.annotation/jakarta.annotation-api/1.3.5/59eb84ee0d616332ff44aba065f3888cf002cd2d/jakarta.annotation-api-1.3.5.jar:/Users/limyongtae/.gradle/caches/modules-2/files-2.1/org.springframework/spring-core/5.3.1/47af5b161749cd249fc074b4f140e011a3337efd/spring-core-5.3.1.jar:/Users/limyongtae/.gradle/caches/modules-2/files-2.1/org.yaml/snakeyaml/1.27/359d62567480b07a679dc643f82fc926b100eed5/snakeyaml-1.27.jar:/Users/limyongtae/.gradle/caches/modules-2/files-2.1/org.springframework.boot/spring-boot-actuator/2.4.0/ac95643b64bb2784cb9f041fc5a59afcad3a11e5/spring-boot-actuator-2.4.0.jar:/Users/limyongtae/.gradle/caches/modules-2/files-2.1/org.hdrhistogram/HdrHistogram/2.1.12/6eb7552156e0d517ae80cc2247be1427c8d90452/HdrHistogram-2.1.12.jar:/Users/limyongtae/.gradle/caches/modules-2/files-2.1/com.fasterxml.jackson.datatype/jackson-datatype-jdk8/2.11.3/dcdfce3e4af9da18d69b1be6f3d7c91256105831/jackson-datatype-jdk8-2.11.3.jar:/Users/limyongtae/.gradle/caches/modules-2/files-2.1/com.fasterxml.jackson.datatype/jackson-datatype-jsr310/2.11.3/dd53d93fd448b345eeb75bec336d9c91dc56b796/jackson-datatype-jsr310-2.11.3.jar:/Users/limyongtae/.gradle/caches/modules-2/files-2.1/com.fasterxml.jackson.module/jackson-module-parameter-names/2.11.3/ab66d5c5b8008161ae89be8a3d98efff9ef1b915/jackson-module-parameter-names-2.11.3.jar:/Users/limyongtae/.gradle/caches/modules-2/files-2.1/com.fasterxml.jackson.core/jackson-databind/2.11.3/4f7b27416934dc929bb6c2d2c5fe521829e6a4ec/jackson-databind-2.11.3.jar:/Users/limyongtae/.gradle/caches/modules-2/files-2.1/org.apache.tomcat.embed/tomcat-embed-websocket/9.0.39/7b9607722206ba3045331159a29deb1ffc0f2cdf/tomcat-embed-websocket-9.0.39.jar:/Users/limyongtae/.gradle/caches/modules-2/files-2.1/org.apache.tomcat.embed/tomcat-embed-core/9.0.39/d82e926b31f06e96fccf552e41f1b8b1615d96dc/tomcat-embed-core-9.0.39.jar:/Users/limyongtae/.gradle/caches/modules-2/files-2.1/org.glassfish/jakarta.el/3.0.3/dab46ee1ee23f7197c13d7c40fce14817c9017df/jakarta.el-3.0.3.jar:/Users/limyongtae/.gradle/caches/modules-2/files-2.1/org.springframework/spring-context/5.3.1/736836c8098981ddabd309a0c15f967594da62bc/spring-context-5.3.1.jar:/Users/limyongtae/.gradle/caches/modules-2/files-2.1/org.springframework/spring-aop/5.3.1/25c310880484082ffba3130deb8e10c5afb29f10/spring-aop-5.3.1.jar:/Users/limyongtae/.gradle/caches/modules-2/files-2.1/org.springframework/spring-beans/5.3.1/a4bb5ffad5564e4a0e25955e3a40b1c6158385b2/spring-beans-5.3.1.jar:/Users/limyongtae/.gradle/caches/modules-2/files-2.1/org.springframework/spring-expression/5.3.1/aee660842a21fbf49f6e5921aa07974f1650c498/spring-expression-5.3.1.jar:/Users/limyongtae/.gradle/caches/modules-2/files-2.1/ch.qos.logback/logback-classic/1.2.3/7c4f3c474fb2c041d8028740440937705ebb473a/logback-classic-1.2.3.jar:/Users/limyongtae/.gradle/caches/modules-2/files-2.1/org.apache.logging.log4j/log4j-to-slf4j/2.13.3/966f6fd1af4959d6b12bfa880121d4a2b164f857/log4j-to-slf4j-2.13.3.jar:/Users/limyongtae/.gradle/caches/modules-2/files-2.1/org.slf4j/jul-to-slf4j/1.7.30/d58bebff8cbf70ff52b59208586095f467656c30/jul-to-slf4j-1.7.30.jar:/Users/limyongtae/.gradle/caches/modules-2/files-2.1/org.springframework/spring-jcl/5.3.1/1158888aa7517f8997eb43afe47776d9d2de8a38/spring-jcl-5.3.1.jar:/Users/limyongtae/.gradle/caches/modules-2/files-2.1/com.fasterxml.jackson.core/jackson-core/2.11.3/c2351800432bdbdd8284c3f5a7f0782a352aa84a/jackson-core-2.11.3.jar:/Users/limyongtae/.gradle/caches/modules-2/files-2.1/com.fasterxml.jackson.core/jackson-annotations/2.11.3/25d4e9c777e7a8805c4a000a8629d3009c779c9b/jackson-annotations-2.11.3.jar:/Users/limyongtae/.gradle/caches/modules-2/files-2.1/ch.qos.logback/logback-core/1.2.3/864344400c3d4d92dfeb0a305dc87d953677c03c/logback-core-1.2.3.jar:/Users/limyongtae/.gradle/caches/modules-2/files-2.1/org.slf4j/slf4j-api/1.7.30/b5a4b6d16ab13e34a88fae84c35cd5d68cac922c/slf4j-api-1.7.30.jar:/Users/limyongtae/.gradle/caches/modules-2/files-2.1/org.apache.logging.log4j/log4j-api/2.13.3/ec1508160b93d274b1add34419b897bae84c6ca9/log4j-api-2.13.3.jar:/Users/limyongtae/.gradle/caches/modules-2/files-2.1/org.springframework.boot/spring-boot-devtools/2.4.0/c5db16eb1454c26665bc61cd21c3f654714e0ff4/spring-boot-devtools-2.4.0.jar:/Users/limyongtae/.gradle/caches/modules-2/files-2.1/io.micrometer/micrometer-registry-prometheus/1.6.1/a67c4cd9a1e333802a35bd87e5c7b47e13971c93/micrometer-registry-prometheus-1.6.1.jar:/Users/limyongtae/.gradle/caches/modules-2/files-2.1/io.prometheus/simpleclient_common/0.9.0/c6341fbd22d8ff701f281620ff83233358675c24/simpleclient_common-0.9.0.jar:/Users/limyongtae/.gradle/caches/modules-2/files-2.1/org.latencyutils/LatencyUtils/2.0.3/769c0b82cb2421c8256300e907298a9410a2a3d3/LatencyUtils-2.0.3.jar:/Users/limyongtae/.gradle/caches/modules-2/files-2.1/io.prometheus/simpleclient/0.9.0/5c3e6d58bead98e74f738e89b0383f66f005897c/simpleclient-0.9.0.jar com.example.monitoring.MonitoringApplication
{spring.web.resources.chain.cache=false, spring.web.resources.cache.period=0}

  .   ____          _            __ _ _
 /\\ / ___'_ __ _ _(_)_ __  __ _ \ \ \ \
( ( )\___ | '_ | '_| | '_ \/ _` | \ \ \ \
 \\/  ___)| |_)| | | | | || (_| |  ) ) ) )
  '  |____| .__|_| |_|_| |_\__, | / / / /
 =========|_|==============|___/=/_/_/_/
 :: Spring Boot ::                (v2.4.0)

2020-11-26 09:22:06.339  INFO 94758 --- [  restartedMain] c.e.monitoring.MonitoringApplication     : Starting MonitoringApplication using Java 1.8.0_261 on im-yongtaeui-MacBookPro.local with PID 94758 (/Users/limyongtae/Desktop/github/monitoring/build/classes/java/main started by limyongtae in /Users/limyongtae/Desktop/github/monitoring)
2020-11-26 09:22:06.348  INFO 94758 --- [  restartedMain] c.e.monitoring.MonitoringApplication     : The following profiles are active: local
2020-11-26 09:22:06.455  INFO 94758 --- [  restartedMain] .e.DevToolsPropertyDefaultsPostProcessor : Devtools property defaults active! Set 'spring.devtools.add-properties' to 'false' to disable
2020-11-26 09:22:06.455  INFO 94758 --- [  restartedMain] .e.DevToolsPropertyDefaultsPostProcessor : For additional web related logging consider setting the 'logging.level.web' property to 'DEBUG'
2020-11-26 09:22:08.431  INFO 94758 --- [  restartedMain] o.s.b.w.embedded.tomcat.TomcatWebServer  : Tomcat initialized with port(s): 8080 (http)
2020-11-26 09:22:08.443  INFO 94758 --- [  restartedMain] o.apache.catalina.core.StandardService   : Starting service [Tomcat]
2020-11-26 09:22:08.443  INFO 94758 --- [  restartedMain] org.apache.catalina.core.StandardEngine  : Starting Servlet engine: [Apache Tomcat/9.0.39]
2020-11-26 09:22:08.519  INFO 94758 --- [  restartedMain] o.a.c.c.C.[Tomcat].[localhost].[/]       : Initializing Spring embedded WebApplicationContext
2020-11-26 09:22:08.519  INFO 94758 --- [  restartedMain] w.s.c.ServletWebServerApplicationContext : Root WebApplicationContext: initialization completed in 2060 ms
2020-11-26 09:22:08.882  INFO 94758 --- [  restartedMain] o.s.s.concurrent.ThreadPoolTaskExecutor  : Initializing ExecutorService 'applicationTaskExecutor'
2020-11-26 09:22:09.267  INFO 94758 --- [  restartedMain] o.s.b.d.a.OptionalLiveReloadServer       : LiveReload server is running on port 35729
2020-11-26 09:22:09.348  INFO 94758 --- [  restartedMain] o.s.b.w.embedded.tomcat.TomcatWebServer  : Tomcat started on port(s): 8080 (http) with context path ''
2020-11-26 09:22:09.430  INFO 94758 --- [  restartedMain] o.s.b.w.embedded.tomcat.TomcatWebServer  : Tomcat initialized with port(s): 8081 (http)
2020-11-26 09:22:09.431  INFO 94758 --- [  restartedMain] o.apache.catalina.core.StandardService   : Starting service [Tomcat]
2020-11-26 09:22:09.432  INFO 94758 --- [  restartedMain] org.apache.catalina.core.StandardEngine  : Starting Servlet engine: [Apache Tomcat/9.0.39]
2020-11-26 09:22:09.441  INFO 94758 --- [  restartedMain] o.a.c.c.C.[Tomcat-1].[localhost].[/]     : Initializing Spring embedded WebApplicationContext
2020-11-26 09:22:09.441  INFO 94758 --- [  restartedMain] w.s.c.ServletWebServerApplicationContext : Root WebApplicationContext: initialization completed in 87 ms
2020-11-26 09:22:09.454  INFO 94758 --- [  restartedMain] o.s.b.a.e.web.EndpointLinksResolver      : Exposing 4 endpoint(s) beneath base path '/actuator'
2020-11-26 09:22:09.521  INFO 94758 --- [  restartedMain] o.s.b.w.embedded.tomcat.TomcatWebServer  : Tomcat started on port(s): 8081 (http) with context path ''
2020-11-26 09:22:09.559  INFO 94758 --- [  restartedMain] c.e.monitoring.MonitoringApplication     : Started MonitoringApplication in 3.955 seconds (JVM running for 6.197)
2020-11-26 09:22:15.281  INFO 94758 --- [0.1-8081-exec-1] o.a.c.c.C.[Tomcat-1].[localhost].[/]     : Initializing Spring DispatcherServlet 'dispatcherServlet'
2020-11-26 09:22:15.281  INFO 94758 --- [0.1-8081-exec-1] o.s.web.servlet.DispatcherServlet        : Initializing Servlet 'dispatcherServlet'
2020-11-26 09:22:15.282  INFO 94758 --- [0.1-8081-exec-1] o.s.web.servlet.DispatcherServlet        : Completed initialization in 1 ms
actuator 관련 로그 내용을 정리해보겠습니다.
- tomcat이 8081으로 initialied
- 기본 경로 '/actuator'로 endpoint 4개가 노출되었다.
- tomcat 8081 시작
application.yaml에 info, health, metrics, promethues 4개를 설정했으므로 endpoint 4개가 노출되었습니다.
Enpoint 목록 확인
주소창에 localhost:8081/actuator 를 입력합니다.

크롬을 사용하였습니다.
크롬 확장판 JSON Formatter를 다운받아 적용합니다.
전 여기서 prometheus endpoint를 이용하여 모니터링을 진행하겠습니다.
다시 주소창에 localhost:8081/actuator/prometheus 를 입력합니다.
# HELP process_uptime_seconds The uptime of the Java virtual machine
# TYPE process_uptime_seconds gauge
process_uptime_seconds 558.05
# HELP jvm_classes_unloaded_classes_total The total number of classes unloaded since the Java virtual machine has started execution
# TYPE jvm_classes_unloaded_classes_total counter
jvm_classes_unloaded_classes_total 0.0
# HELP logback_events_total Number of error level events that made it to the logs
# TYPE logback_events_total counter
logback_events_total{level="warn",} 0.0
logback_events_total{level="debug",} 0.0
logback_events_total{level="error",} 0.0
logback_events_total{level="trace",} 0.0
logback_events_total{level="info",} 14.0
# HELP system_load_average_1m The sum of the number of runnable entities queued to available processors and the number of runnable entities running on the available processors averaged over a period of time
# TYPE system_load_average_1m gauge
system_load_average_1m 6.2724609375
# HELP jvm_gc_live_data_size_bytes Size of long-lived heap memory pool after reclamation
# TYPE jvm_gc_live_data_size_bytes gauge
jvm_gc_live_data_size_bytes 1.5091888E7
# HELP jvm_threads_live_threads The current number of live threads including both daemon and non-daemon threads
# TYPE jvm_threads_live_threads gauge
jvm_threads_live_threads 42.0
# HELP jvm_memory_committed_bytes The amount of memory in bytes that is committed for the Java virtual machine to use
# TYPE jvm_memory_committed_bytes gauge
jvm_memory_committed_bytes{area="heap",id="PS Survivor Space",} 1.4680064E7
jvm_memory_committed_bytes{area="heap",id="PS Old Gen",} 1.72490752E8
jvm_memory_committed_bytes{area="heap",id="PS Eden Space",} 1.49946368E8
jvm_memory_committed_bytes{area="nonheap",id="Metaspace",} 3.7920768E7
jvm_memory_committed_bytes{area="nonheap",id="Code Cache",} 7340032.0
jvm_memory_committed_bytes{area="nonheap",id="Compressed Class Space",} 5414912.0
# HELP process_cpu_usage The "recent cpu usage" for the Java Virtual Machine process
# TYPE process_cpu_usage gauge
process_cpu_usage 0.0
# HELP process_files_open_files The open file descriptor count
# TYPE process_files_open_files gauge
process_files_open_files 99.0
# HELP system_cpu_usage The "recent cpu usage" for the whole system
# TYPE system_cpu_usage gauge
system_cpu_usage 0.0
# HELP tomcat_sessions_created_sessions_total
# TYPE tomcat_sessions_created_sessions_total counter
tomcat_sessions_created_sessions_total 0.0
# HELP process_start_time_seconds Start time of the process since unix epoch.
# TYPE process_start_time_seconds gauge
process_start_time_seconds 1.606350123528E9
# HELP jvm_buffer_total_capacity_bytes An estimate of the total capacity of the buffers in this pool
# TYPE jvm_buffer_total_capacity_bytes gauge
jvm_buffer_total_capacity_bytes{id="direct",} 24576.0
jvm_buffer_total_capacity_bytes{id="mapped",} 0.0
# HELP tomcat_sessions_active_current_sessions
# TYPE tomcat_sessions_active_current_sessions gauge
tomcat_sessions_active_current_sessions 0.0
# HELP jvm_buffer_count_buffers An estimate of the number of buffers in the pool
# TYPE jvm_buffer_count_buffers gauge
jvm_buffer_count_buffers{id="direct",} 3.0
jvm_buffer_count_buffers{id="mapped",} 0.0
# HELP tomcat_sessions_active_max_sessions
# TYPE tomcat_sessions_active_max_sessions gauge
tomcat_sessions_active_max_sessions 0.0
# HELP jvm_memory_used_bytes The amount of used memory
# TYPE jvm_memory_used_bytes gauge
jvm_memory_used_bytes{area="heap",id="PS Survivor Space",} 0.0
jvm_memory_used_bytes{area="heap",id="PS Old Gen",} 1.5091888E7
jvm_memory_used_bytes{area="heap",id="PS Eden Space",} 3.981412E7
jvm_memory_used_bytes{area="nonheap",id="Metaspace",} 3.5011544E7
jvm_memory_used_bytes{area="nonheap",id="Code Cache",} 7269696.0
jvm_memory_used_bytes{area="nonheap",id="Compressed Class Space",} 4826232.0
# HELP jvm_gc_memory_allocated_bytes_total Incremented for an increase in the size of the (young) heap memory pool after one GC to before the next
# TYPE jvm_gc_memory_allocated_bytes_total counter
jvm_gc_memory_allocated_bytes_total 1.53938536E8
# HELP jvm_classes_loaded_classes The number of classes that are currently loaded in the Java virtual machine
# TYPE jvm_classes_loaded_classes gauge
jvm_classes_loaded_classes 7242.0
# HELP jvm_gc_pause_seconds Time spent in GC pause
# TYPE jvm_gc_pause_seconds summary
jvm_gc_pause_seconds_count{action="end of major GC",cause="Metadata GC Threshold",} 1.0
jvm_gc_pause_seconds_sum{action="end of major GC",cause="Metadata GC Threshold",} 0.152
jvm_gc_pause_seconds_count{action="end of minor GC",cause="Metadata GC Threshold",} 1.0
jvm_gc_pause_seconds_sum{action="end of minor GC",cause="Metadata GC Threshold",} 0.028
jvm_gc_pause_seconds_count{action="end of minor GC",cause="Allocation Failure",} 1.0
jvm_gc_pause_seconds_sum{action="end of minor GC",cause="Allocation Failure",} 0.017
# HELP jvm_gc_pause_seconds_max Time spent in GC pause
# TYPE jvm_gc_pause_seconds_max gauge
jvm_gc_pause_seconds_max{action="end of major GC",cause="Metadata GC Threshold",} 0.0
jvm_gc_pause_seconds_max{action="end of minor GC",cause="Metadata GC Threshold",} 0.0
jvm_gc_pause_seconds_max{action="end of minor GC",cause="Allocation Failure",} 0.0
# HELP system_cpu_count The number of processors available to the Java virtual machine
# TYPE system_cpu_count gauge
system_cpu_count 4.0
# HELP jvm_memory_max_bytes The maximum amount of memory in bytes that can be used for memory management
# TYPE jvm_memory_max_bytes gauge
jvm_memory_max_bytes{area="heap",id="PS Survivor Space",} 1.4680064E7
jvm_memory_max_bytes{area="heap",id="PS Old Gen",} 2.863661056E9
jvm_memory_max_bytes{area="heap",id="PS Eden Space",} 1.401946112E9
jvm_memory_max_bytes{area="nonheap",id="Metaspace",} -1.0
jvm_memory_max_bytes{area="nonheap",id="Code Cache",} 2.5165824E8
jvm_memory_max_bytes{area="nonheap",id="Compressed Class Space",} 1.073741824E9
# HELP jvm_gc_memory_promoted_bytes_total Count of positive increases in the size of the old generation memory pool before GC to after GC
# TYPE jvm_gc_memory_promoted_bytes_total counter
jvm_gc_memory_promoted_bytes_total 7236200.0
# HELP jvm_threads_daemon_threads The current number of live daemon threads
# TYPE jvm_threads_daemon_threads gauge
jvm_threads_daemon_threads 35.0
# HELP tomcat_sessions_expired_sessions_total
# TYPE tomcat_sessions_expired_sessions_total counter
tomcat_sessions_expired_sessions_total 0.0
# HELP jvm_threads_peak_threads The peak live thread count since the Java virtual machine started or peak was reset
# TYPE jvm_threads_peak_threads gauge
jvm_threads_peak_threads 47.0
# HELP tomcat_sessions_rejected_sessions_total
# TYPE tomcat_sessions_rejected_sessions_total counter
tomcat_sessions_rejected_sessions_total 0.0
# HELP jvm_gc_max_data_size_bytes Max size of long-lived heap memory pool
# TYPE jvm_gc_max_data_size_bytes gauge
jvm_gc_max_data_size_bytes 2.863661056E9
# HELP jvm_threads_states_threads The current number of threads having NEW state
# TYPE jvm_threads_states_threads gauge
jvm_threads_states_threads{state="runnable",} 13.0
jvm_threads_states_threads{state="blocked",} 0.0
jvm_threads_states_threads{state="waiting",} 23.0
jvm_threads_states_threads{state="timed-waiting",} 6.0
jvm_threads_states_threads{state="new",} 0.0
jvm_threads_states_threads{state="terminated",} 0.0
# HELP jvm_buffer_memory_used_bytes An estimate of the memory that the Java virtual machine is using for this buffer pool
# TYPE jvm_buffer_memory_used_bytes gauge
jvm_buffer_memory_used_bytes{id="direct",} 24576.0
jvm_buffer_memory_used_bytes{id="mapped",} 0.0
# HELP process_files_max_files The maximum file descriptor count
# TYPE process_files_max_files gauge
process_files_max_files 10240.0
# HELP tomcat_sessions_alive_max_seconds
# TYPE tomcat_sessions_alive_max_seconds gauge
tomcat_sessions_alive_max_seconds 0.0
prometheus가 pull할 수 있는 endpoint를 제공해줍니다.
나만의 tag를 만들어보자
Controller, Service를 만들어줍니다.
@RestController
@RequiredArgsConstructor
public class YongRestController {

    private final YongService yongService;

    @GetMapping(value = "/yong/counter/increment")
    public String counterIncrement() {
        String increment = yongService.Increment();
        return increment;
    }
}
@Service
public class YongService {
    private Counter counter;

    @Autowired
    public YongService(MeterRegistry registry) {
        this.counter = registry.counter("yong.counter", Tags.of("study", "run"));
    }

    public String Increment() {
        counter.increment();
        return "increment success.";
    }
}
간단히 정리하자면 "yong/counter/increment" API를 실행하면 yong.counter study=run 값이 1씩 증가합니다.
여기까지 적용하고 다시 http://localhost:8081/actuator/prometheus 입력합니다.
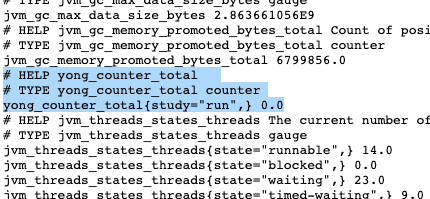
yong.counter가 추가된 것을 확인할 수 있습니다.
그럼 localhost:8080/yong/counter/increment 를 실행해보겠습니다.

실행된 것을 확인하고 다시 http://localhost:8081/actuator/prometheus 입력합니다.

yong counter study=run 값이 1이 증가한 것을 확인할 수 있습니다. 이렇게 의미있는 정보들을 생성하여 모니터링에 보여질 수 있습니다.
다음글에서 이 정보들을 이용하여 Prometheus를 띄워보겠습니다.
[Monitoring] Actuator, Prometheus를 이용한 monitoring해보자!