Monitoring을 구현해보자!
모든 소스는 Github에 올려두었습니다.

왜 Monitoring을 사용해야하는가?
먼저 Monitoring의 중요성에 대해서 간략히 정리해보겠습니다.
Monitoring이 없는 서비스를 운영하고 있다고 가정합니다. 그 와중 버그가 없다면 다행이지만 버그가 발생하는 경우가 생깁니다. 만약 Monitoring이 없다면 버그가 발생했는지 조차 인지하지 못하고 고객센터를 통해 문의가 들어와야 확인할 수 있을 것 입니다. 또한 서버 용량, 메모리등의 문제로 서버가 다운될 수도 있습니다. 이럴 경우 선 버그 후 조치가 이루어질 것입니다. 하지만 Monitoring이 있었다면 버그가 발생하기 전 예방할 수 있고 문제가 되었을 경우 시각적으로 제공되는 데이터를 통해 대응을 빠르게 할 수 있는 장점이 있습니다.
정의
Monitoring에 구성될 기술 스택 및 구현 방법에 대해서 간랸하게 정리해보겠습니다.
- Prometheus : 데이터를 수집하는 Tool
- Grafana : 데이터를 시각화하기 편하게 도와주는 Dashboard
- CAdvisor : Node 상의 Docker 정보를 수집
- Node-Exporter : Node의 정보 수집
- Alert-Manager : 데이터를 일정 조건에 의하여 Alert하는 Tool
아키텍쳐
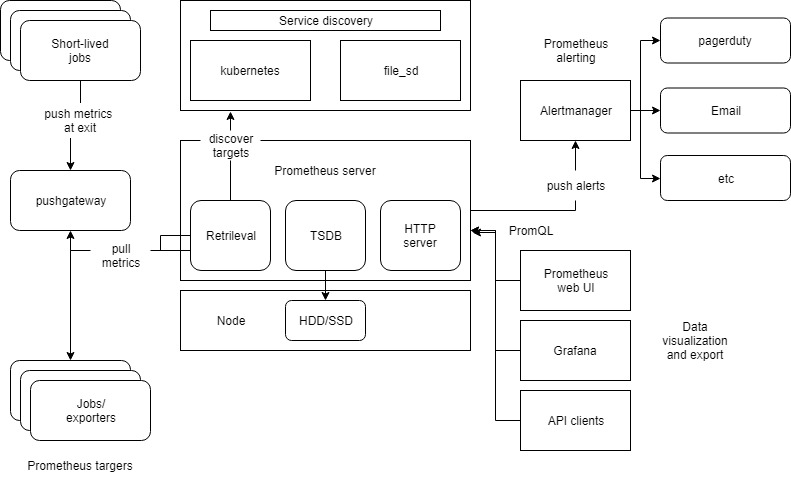
위 그림을 간략하게 정리해보겠습니다.
- 각 Exporter 들이 역할에 맞는 데이터를 수집합니다.
- 수집 된 데이터를 Prometheus가 Polling 방식으로 데이터를 수집합니다.
- Grafana에서 PromQL 방식으로 Prometheus에 적재된 데이터를 조회하여 Dashboard에 보여줍니다.
- Prometheus에서 데이터가 Rule 조건이 되면 AlertManager를 통해 Alert을 발생시킵니다.
구현
Kotlin 기반 프로젝트 구성
운영 될 서비스의 정보를 수집할 Exporter를 설정합니다. 먼저 의존성을 주입받습니다. build.gradle.kts에 아래와 같이 설정합니다.
build.gradle.kts
// build.gradle.kts
dependencies {
implementation("org.springframework.boot:spring-boot-starter-actuator")
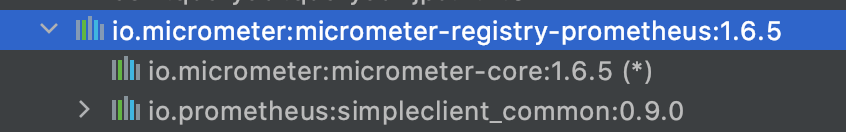
runtimeOnly("io.micrometer:micrometer-registry-prometheus")
}
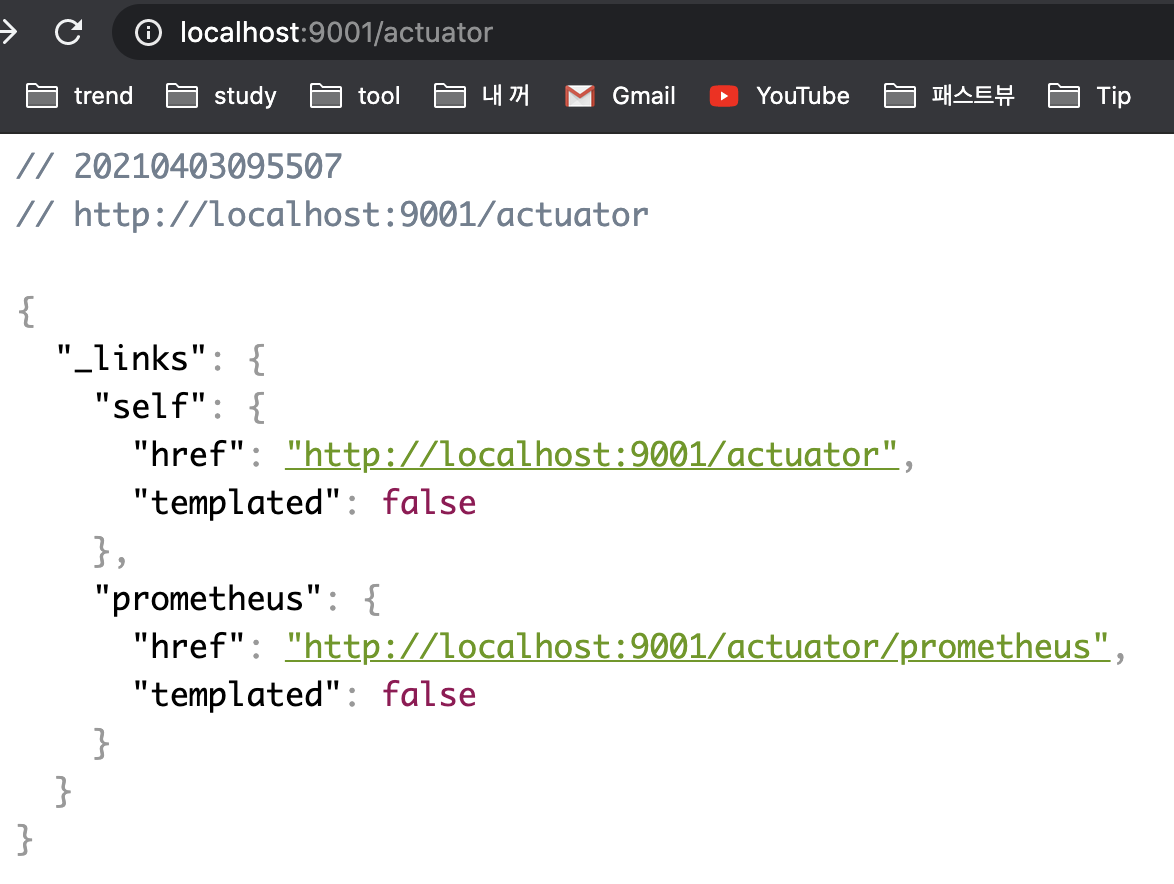
잘 들어왔는지 확인합니다.
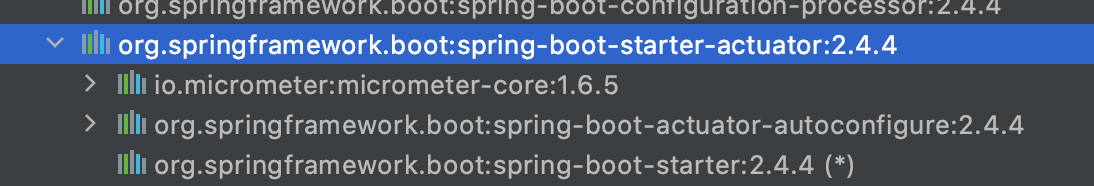
actuator : 서비스의 데이터를 수집하고 수집된 데이터를 조회하기 쉽도록 endpoint를 제공합니다.
prometheus : actuator로 수집된 데이터를 prometheus에서 조회할 수 있도록 가공하여 endpoint를 제공합니다.
application.yaml
# monitoring setting
management:
  metrics:
    tags:
      application: sample-apis  1)
  endpoint:
    shutdown:
      enabled: false  # 2)

  endpoints:
    web:
      exposure:
        include:
          - "prometheus"  3)
1) Grafana에서 application명으로 쉽게 조건을 걸 수 있도록 도와주는 설정입니다.
2) actuator의 endpoint로 서비스를 shutdown 시킬 수 있습니다. 외부 사용자가 악의적으로 서비스를 다운시킬 수 있어 이 설정은 false로 설정합니다.
3) actuator에 prometheus endpoint 추가해줍니다.
여기까지 설정하고 서비스를 띄우면 endpoint를 확인할 수 있습니다. 기본 url은 /actuator입니다.
새로운 정보를 데이터 수집하도록 구성
서비스를 Monitoring하다보면 기본적으로 제공하는 정보뿐만 아니라 내가 원하는 정보를 필요로 할 때도 있습니다. 예를 들어 결제가 발생, 결제 실패/성공 등을 수집하고 싶다고 할 때 새로운 Tag를 추가하여 수집할 수 있습니다.
패키지 구성을 살펴보겠습니다.
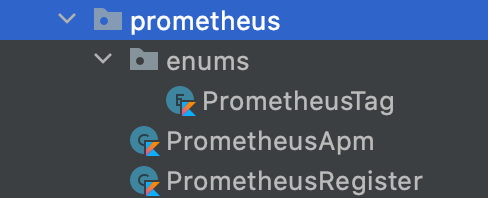
한 개씩 살펴보겠습니다.
// Tag 열거형
enum class PrometheusTag(name: String) {
    BUY("buy"),
    SELL("sell")
}
// Prometheus에 Tag를 등록
@Component
class PrometheusRegister(val registry: MeterRegistry) {
companion object {
lateinit var buyCounter: Counter
lateinit var sellCounter: Counter
}
init {
buyCounter = registry.counter("sellermill", Tags.of("product", PrometheusTag.BUY.name))
sellCounter = registry.counter("sellermill", Tags.of("product", PrometheusTag.SELL.name))
}
}// 로직 중 실제 사용되는 객체로 각 태그값을 설정합니다.
class PrometheusApm {
infix fun counting(tag: PrometheusTag) = when(tag) {
PrometheusTag.BUY -> PrometheusRegister.buyCounter.increment()
PrometheusTag.SELL -> PrometheusRegister.sellCounter.increment()
// else -> ""
}
}
설정을 마무리하고 실제 사용해보겠습니다.
@RestController
@RequestMapping("/api/products")
class ApmController {
companion object {
private val prometheusApm: PrometheusApm = PrometheusApm()
}
@GetMapping("/buy")
fun buyProducts() {
prometheusApm counting BUY // buy tag counting
}
@GetMapping("/sell")
fun sellProduct() {
prometheusApm counting SELL // sell tag counting
}
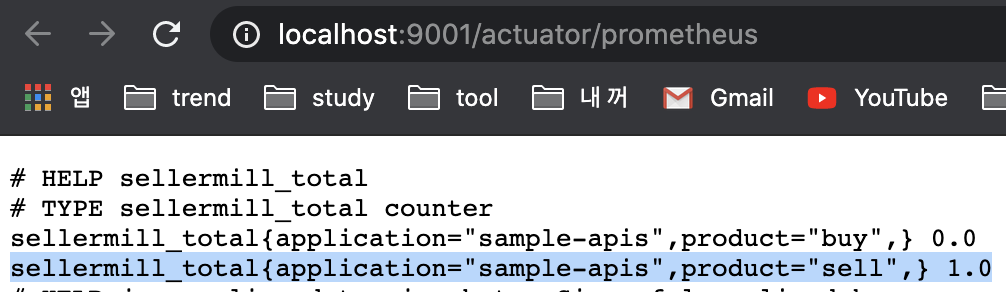
}간단한 RestAPI를 생성하고 호출하여 Counting 해보겠습니다.
http://localhost:9001/api/products/sell # 호출
endpoint를 확인하여 변경 된 tag값을 확인할 수 있습니다.
설정을 마쳤다면 Application을 도커로 띄웁니다.
docker로 띄우는 방법은 이 글에서 자세히 다루지 않겠습니다. 필요하시면 이 글을 참조해주세요.
Node-Exporter
Node의 정보를 수집하는 Exporter입니다. node-exporter는 docker로 구성하지 않는 것을 권장하지 않습니다.
이유는 도커는 머신의 내부동작과 컨테이너를 격리시키려고 하기 때문에 노드 익스포터에서 내부 동작 결과가 잘동작하지 않을 수 있기 때문입니다.
데이터 수집할 대상 Node에 접근하여 설치를 진행합니다.
제가 설치할 당시의 가장 최신버전으로 설치하였습니다.
다운로드 버전은 다운로드 페이지에서 확인해주시기 바랍니다.
// wget을 이용하여 node-exporter 다운로드
1. wget https://github.com/prometheus/node_exporter/releases/download/v1.1.2/node_exporter-1.1.2.linux-amd64.tar.gz

// 다운로드 된 tar 파일의 압축 해제
2. tar xvfz node_exporter-1.1.2.linux-amd64.tar.gz

// 경로 설정
3. mv node_exporter-1.1.2.linux-amd64/node_exporter /usr/local/bin/

// node-exporter를 실행합니다. port는 기본으로 9100이 잡힙니다.
4. /usr/local/bin/node_exporter --web.listen-address=:9100
Node-Exporter에 대해서 자세히 살펴보시려면 공식 홈페이지를 참조해주세요.
CAdvisor
Node에서 실행중인 docker의 정보를 수집합니다.
docker-compose.yml을 사용하여 docker로 띄워줍니다.
version: "3"

services:
  cadvisor:
    image: google/cadvisor
    container_name: cadvisor
    volumes:
      - /:/rootfs:ro
      - /var/run:/var/run:ro
      - /sys:/sys:ro
      - /var/lib/docker/:/var/lib/docker:ro
      - /dev/disk/:/dev/disk:ro
    ports:
      - 3100:8080  # docker 외부에서 3100번 포트로 접근하도록 변경
cd ${docker-compose.yml 위치로 이동}
docker-compose -f docker-compose.yml up -d경로가 헷갈리시다면 페이지 상단에 Github의 제 프로젝트를 참조하시어 cadvisor.sh를 실행해주세요.
./cadvisor start
AlertManager
데이터를 수집하고 rule에 따른 alert을 발생시켜주는 툴을 구성해보겠습니다.
먼저 config를 생성합니다.
alertmanager.yml
global:
resolve_timeout: 10s
slack_api_url: 'https://{slack.hook.url}'
route: #라우트 경로 설정
receiver: 'slack-notifications' # 알림 설정 대상 1)
receivers:
- name: 'slack-notifications' # 1)
slack_configs:
- channel: '#service-alert' # 2) slack channel
send_resolved: true
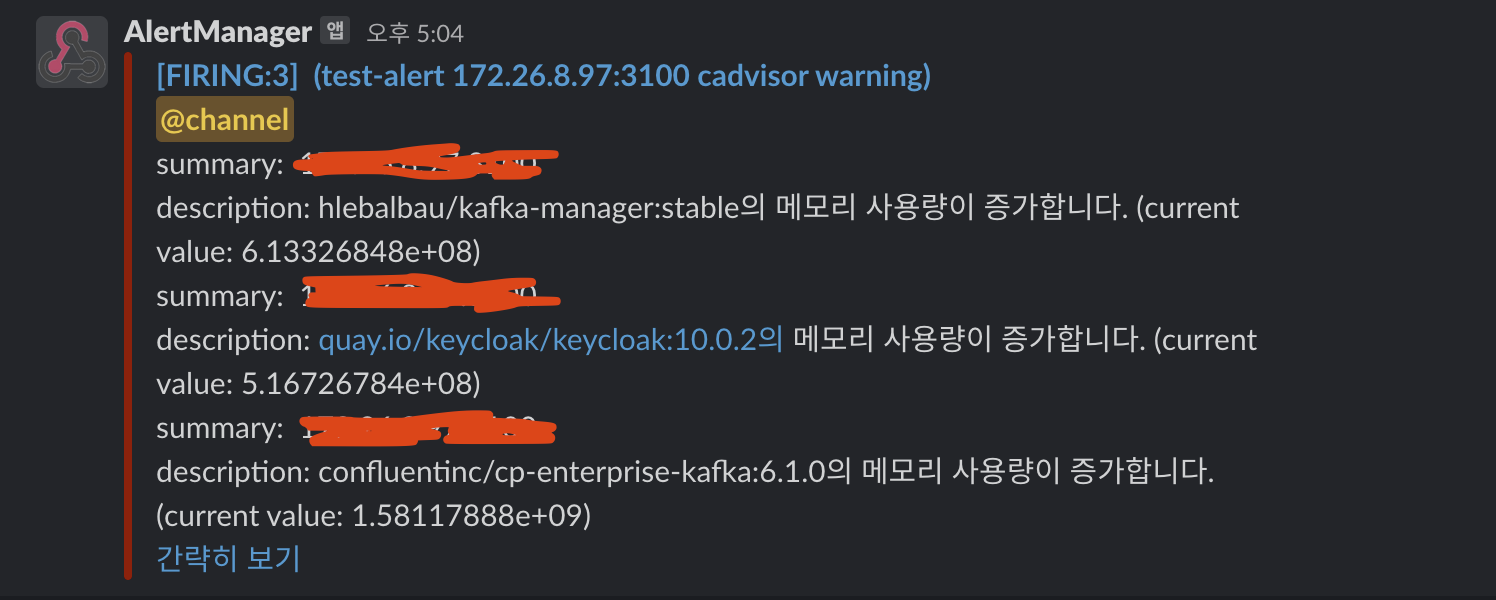
text: "<!channel> {{ range .Alerts}} \nsummary: {{ .Annotations.summary }}\ndescription: {{ .Annotations.description }} {{ end }}" # slack 출력 format
Prometheus, Grafana
수집할 대상의 Exporter 구성을 마쳤습니다. 그럼 수집된 데이터를 수집할 Prometheus와 시각화를 도와줄 Grafana를 구성해보겠습니다.
alert_rule.yml
Prometheus에서 수집한 데이터를 기반으로 어떤 조건이 충족되었을 때 AlertManager에게 신호를 보내도록 설정하는 파일입니다.
groups:
- name: test # 그룹 이름
  rules:
  - alert: test-alert # 알림 이름
    expr:  container_memory_usage_bytes{image!=""} > 500000000 // 1)
    for: 15s
    labels: # 필요한 label들을 설정할 수 있다.
       severity: warning
    annotations:  // 2)
      summary: "{{ $labels.groups }} {{ $labels.instance }}"
      description: "{{ $labels.image }}의 메모리 사용량이 증가합니다. (current value: {{ $value }})"
1) PromQL로 Alert을 발생시킬 조건을 입력합니다.
2) Alert으로 발송될 Alert Message Format을 작성합니다. ( 보다 자세한 내용은 공식홈페이지를 참조해주세요. )
Prometheus.yml
prometheus의 모니터링 타켓 및 alert 관련 설정 파일 지정 설정하는 파일입니다.
# my global config
global:
  scrape_interval:     15s # Set the scrape interval to every 15 seconds. Default is every 1 minute.
  evaluation_interval: 15s # Evaluate rules every 15 seconds. The default is every 1 minute.
  # scrape_timeout is set to the global default (10s).

alerting:
  alertmanagers:
   - static_configs:
     - targets: ['172.1.2.3:9093']    // 1)

# Load rules once and periodically evaluate them according to the global 'evaluation_interval'.
rule_files:
   - "alert_rules.yml"    // 2)

# A scrape configuration containing exactly one endpoint to scrape:
# Here it's Prometheus itself.
scrape_configs:    // 3)
  # The job name is added as a label `job=<job_name>` to any timeseries scraped from this config.
  - job_name: 'prometheus'

    # metrics_path defaults to '/metrics'
    # scheme defaults to 'http'.

    static_configs:
    - targets: ['localhost:9090']

  # service exporter...
  - job_name: 'sertvice1-apis'
    metrics_path: '/actuator/prometheus'
    static_configs:
      - targets: ['172.26.15.204:8181']

  - job_name: 'service2-server'
    metrics_path: '/actuator/prometheus'
    static_configs:
      - targets: ['172.1.2.3:2155']

  # node exporter...
  - job_name: 'node-exporter'
    static_configs:
      - targets: ['172.1.2.4:9100']

  # cadvisor exporter...
  - job_name: 'cadvisor'
    static_configs:
      - targets: ['172.1.2.5:3100']
1) AlertManager 정보를 입력합니다.
2) 위에서 작성한 alert_rules.yml 파일을 설정합니다. ( prometheus.yml 과 동일 경로에 있습니다. )
3) 데이터를 수집할 대상 리스트를 작성합니다.
docker-compose.yml
docker-compose.yml을 통해 prometheus와 grafana를 띄우겠습니다.
version: "3"

services:
  prometheus:
    image: prom/prometheus
    container_name: prometheus
    volumes:
     - ./data/config/prometheus.yml:/etc/prometheus/prometheus.yml  // 1)
    command: "--config.file=/etc/prometheus/prometheus.yml"    // 2)
    ports:
     - 9090:9090
    networks:
     - prometheus-network

  grafana:
    image: grafana/grafana
    container_name: grafana
    user: "$UID:$GID"
    ports:
     - 3000:3000
    depends_on:
      - prometheus
    volumes:
      - ./data/grafana:/var/lib/grafana    // 3)
    networks:
      - prometheus-network
    links:
      - prometheus:prometheus    // 4)

networks:
  prometheus-network:    // 5)
1) 위에서 설정한 yml 파일을 적용하기 위해 volume 시켜줍니다.
2) prometheus가 실행될 때 해당 yml파일을 읽도록 설정합니다.
3) grafana의 data 저장경로를 volume 시킵니다. 이 설정을 하지 않으면 docker를 내리고 올릴때마다 대시보드를 새로 작성해야합니다.
4) prometheus와 연결합니다.
5) prometheus와 grafana는 같은 네트워크를 사용합니다.
docker-compose를 실행합니다.
docker-compose up -d
grafana의 user, password를 따로 설정하지 않았기 때문에 default인 ID : admin, PW : admin 가 설정됩니다.
grafana 설정은 이글을 참조해주세요.
여기까지 하면 모니터링 관련 설정을 모두 마쳤습니다.
예시로 아래 그림은 테스트 서버의 CAdvisor를 통해 수집한 데이터를 대시보드로 시각화한 화면입니다.
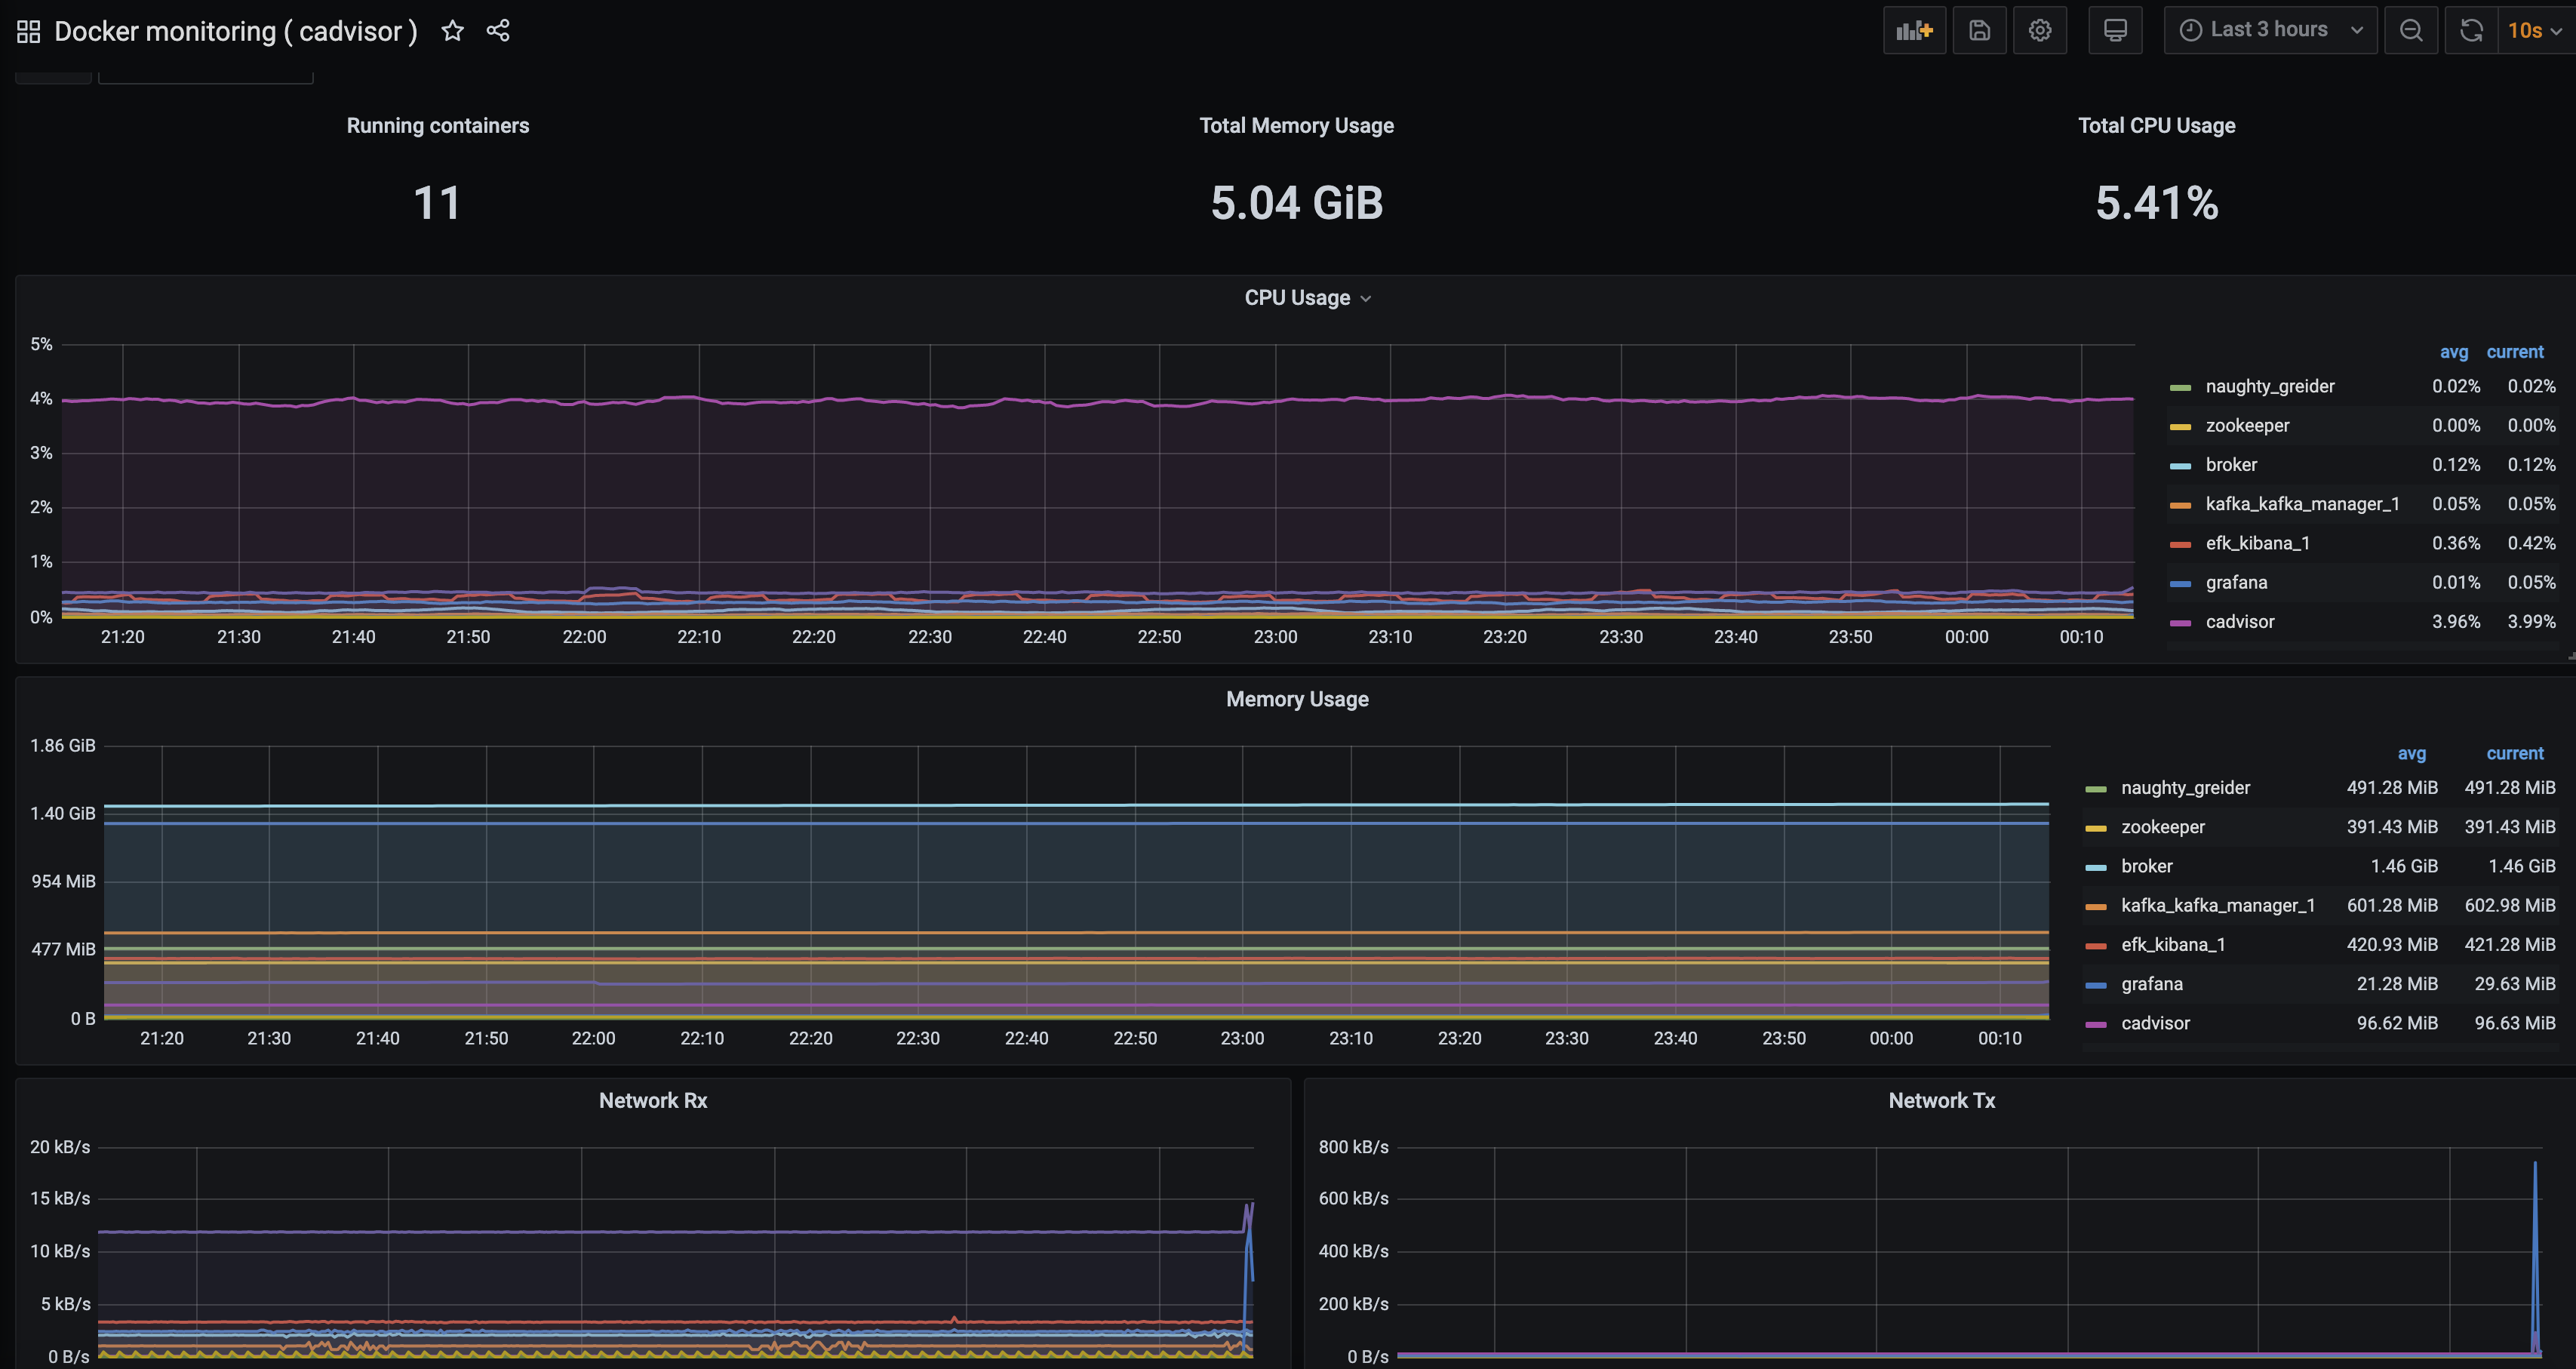
AlertManager도 정상작동하는 것을 확인할 수 있습니다.